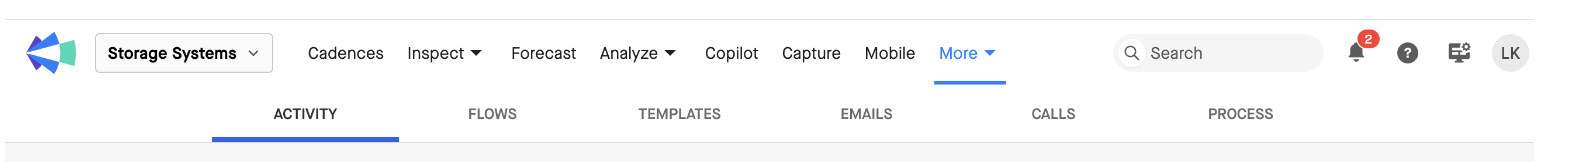
The Analytics page has six sections as tabs at the top:
- Activity
- Flows
- Templates
- Emails
- Calls
- Process
This article covers each of these tabs.
A few important details:
- For standard users, the Process Analytics section will be included within the Flow Analytics section.
- The activities that surface in the Analytics page are displayed in the viewing user's timezone.
- Groove Analytics will display any activities that were created by and/or logged through Groove (whether through Flows, manual logging, or automatic sync).
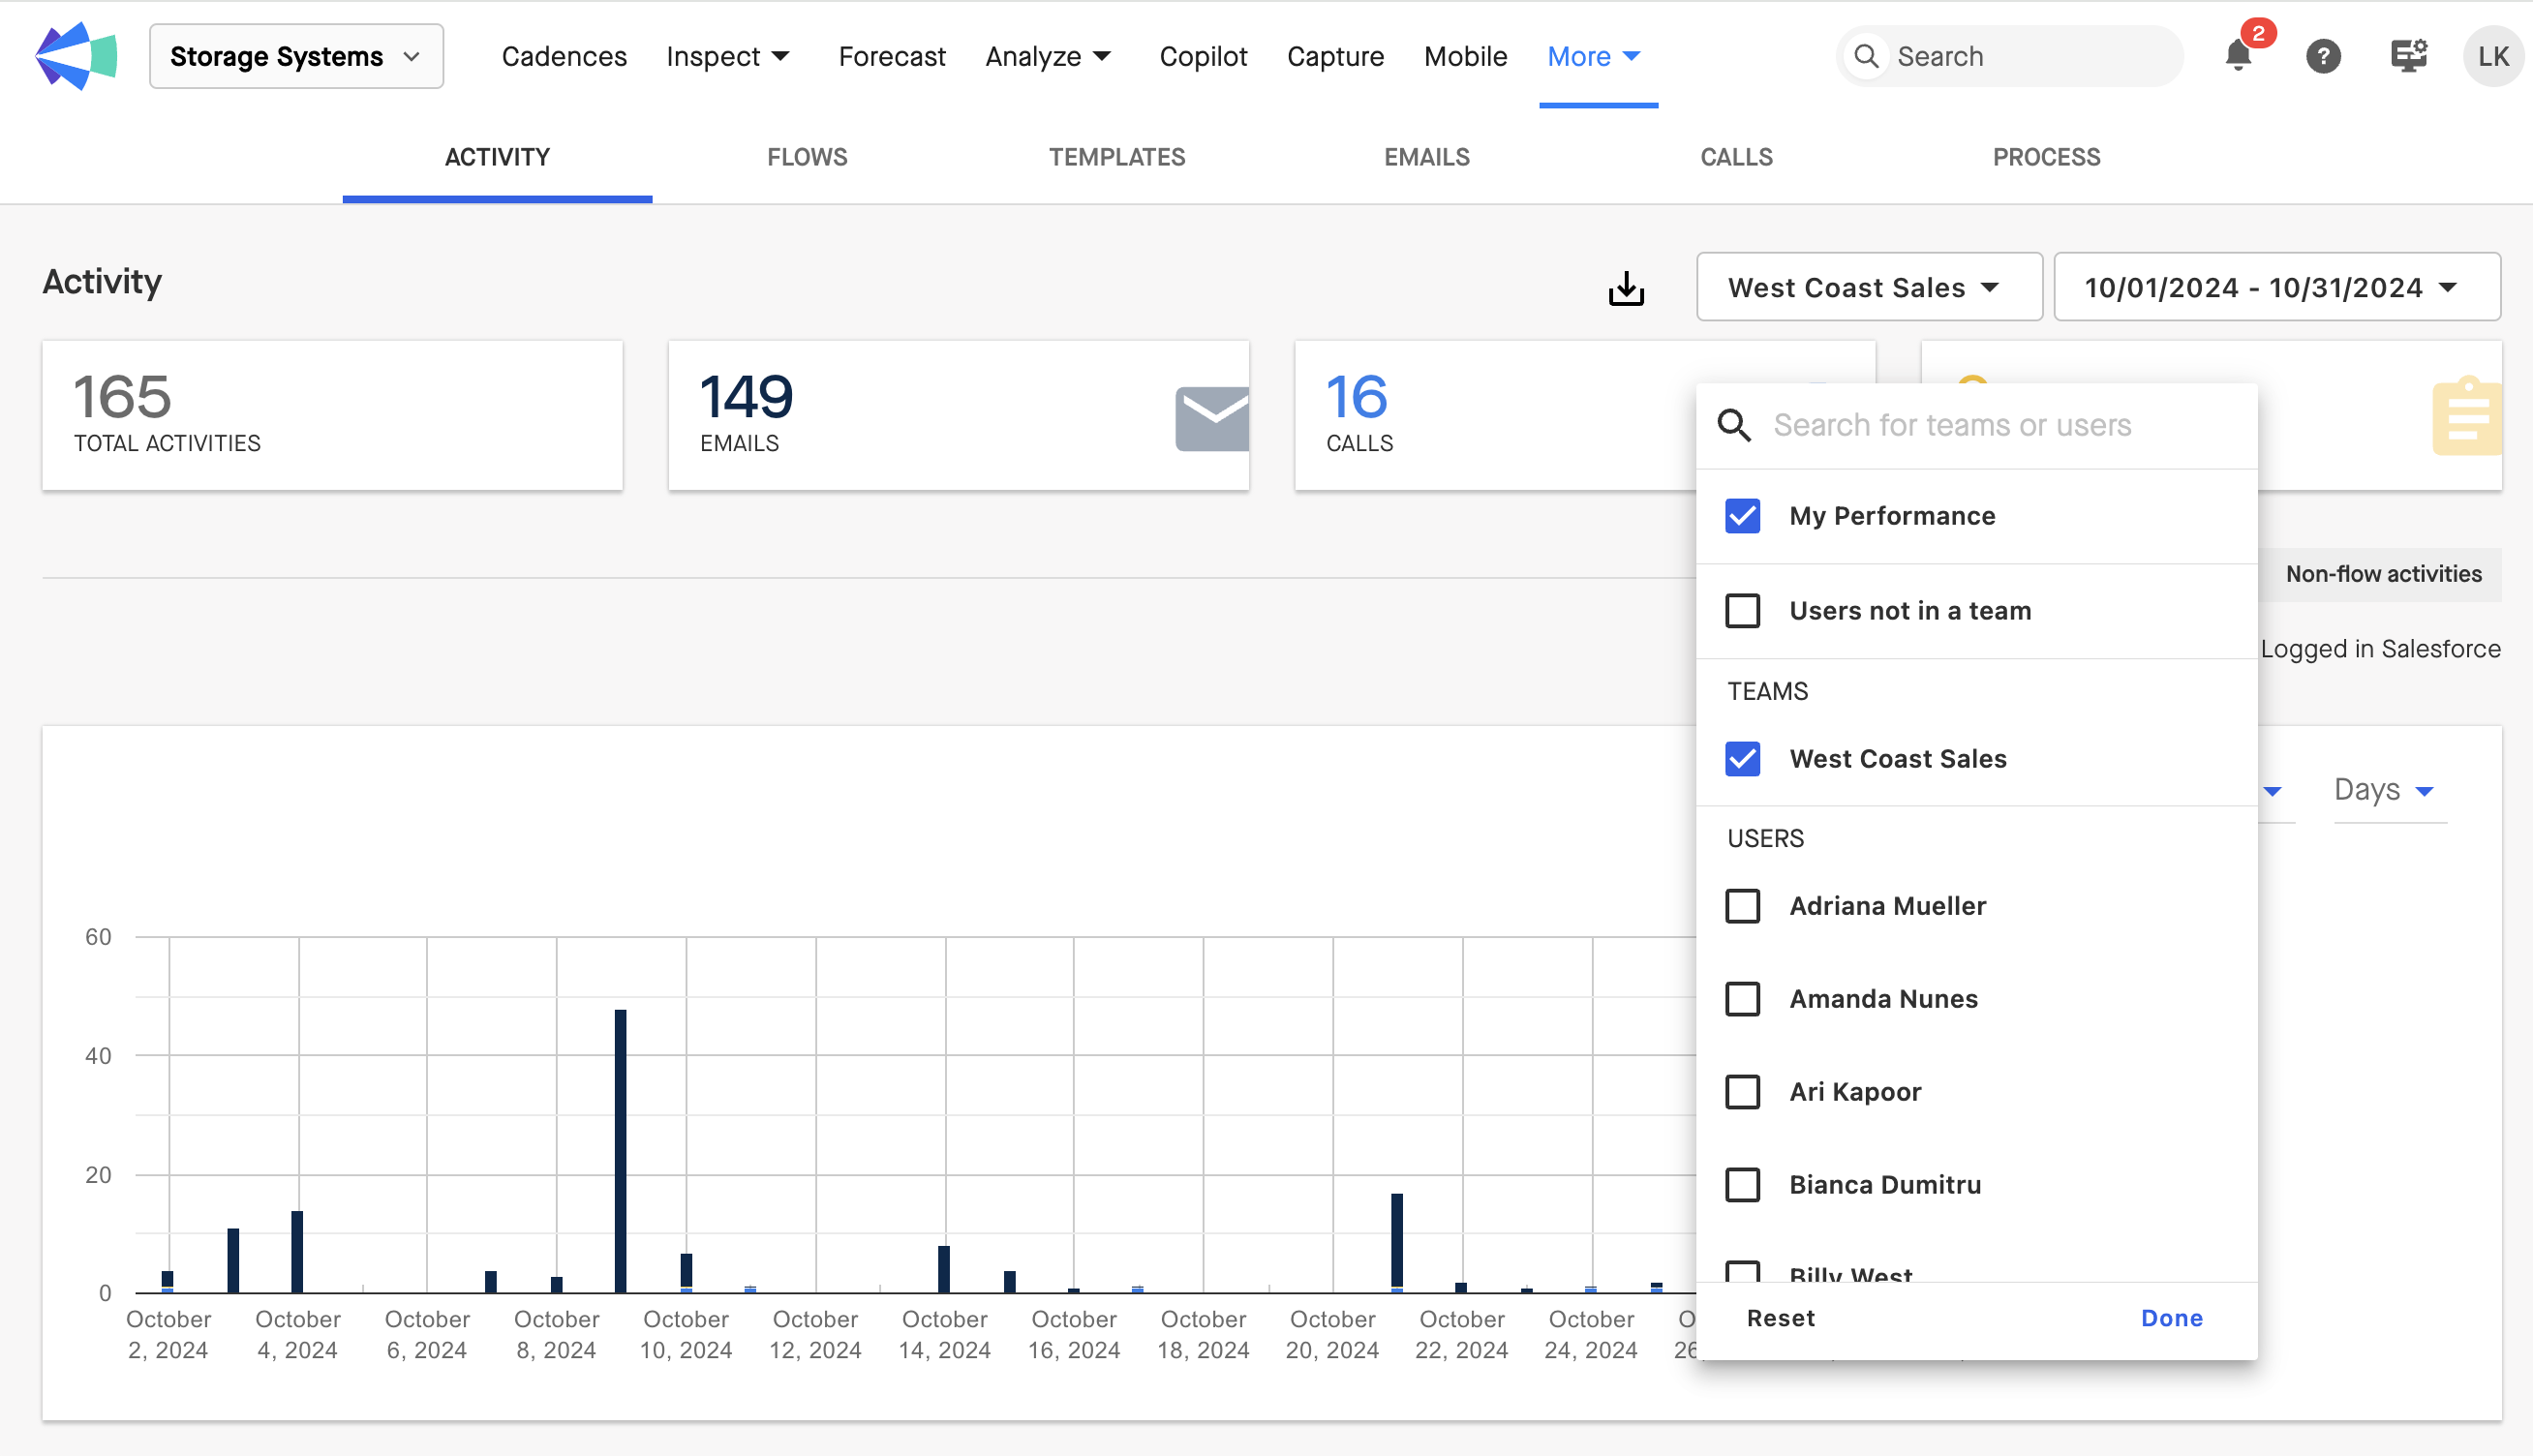
Activity Analytics
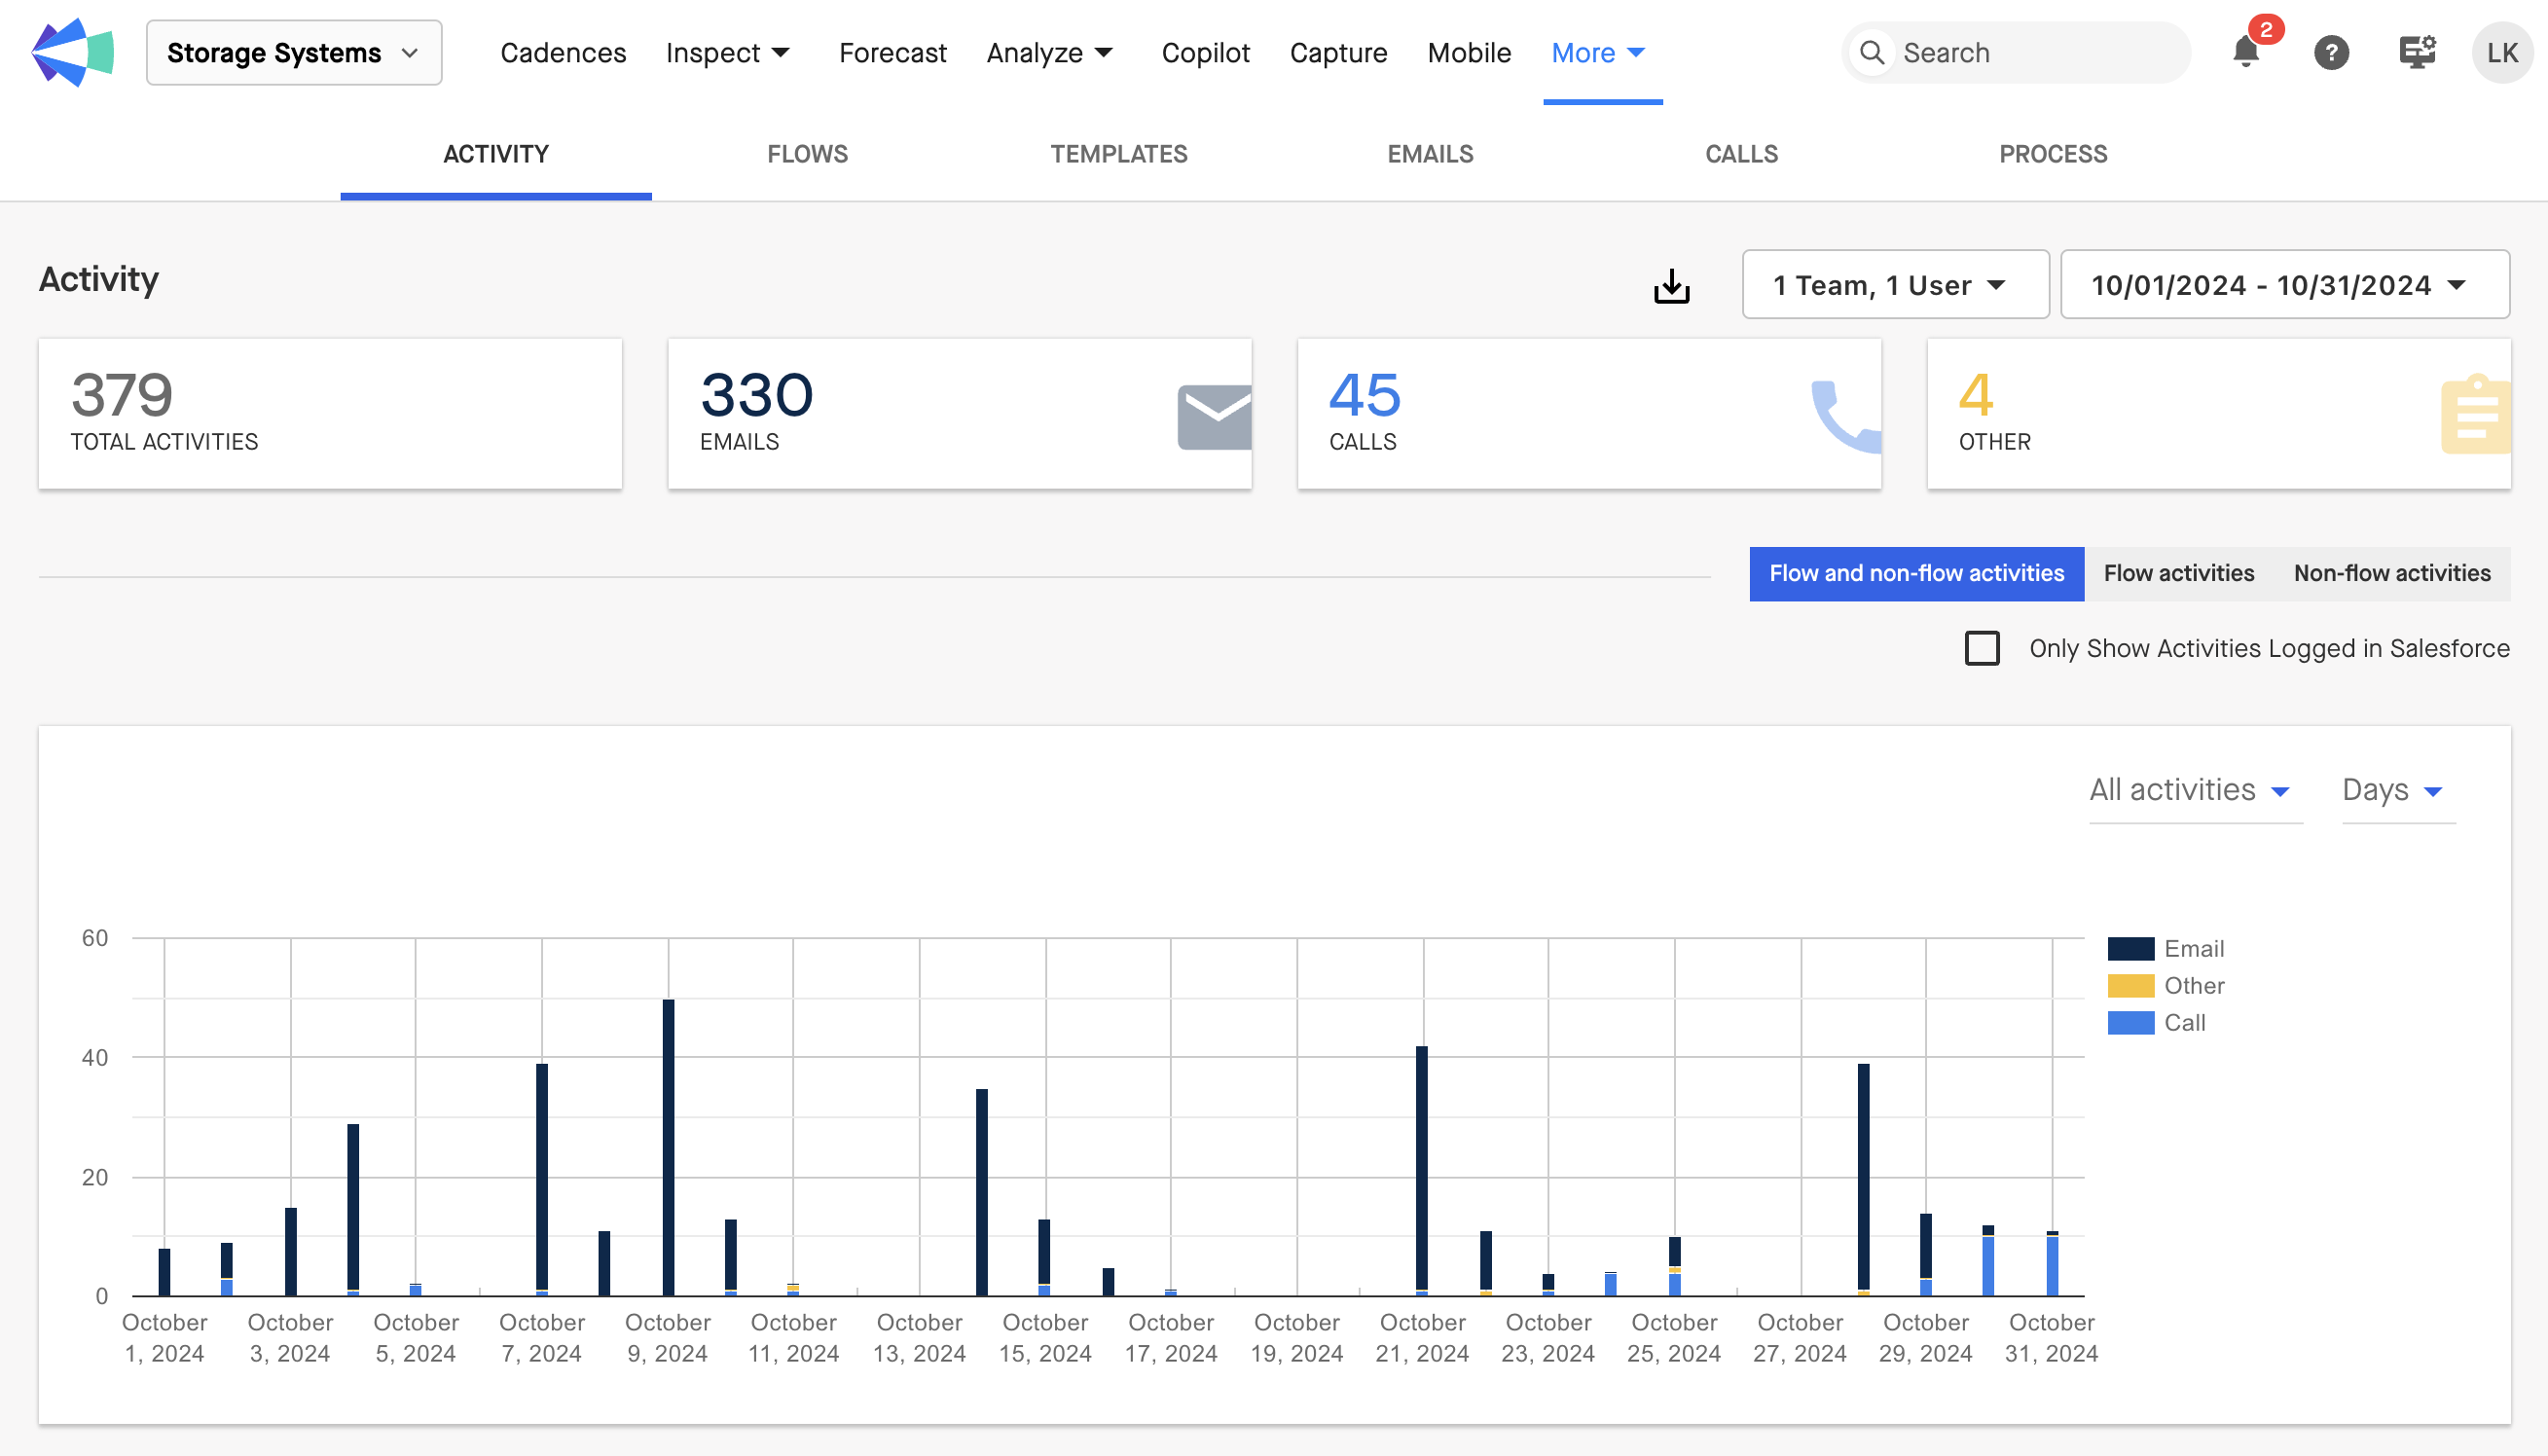
The image above shows Activity Analytics Tab (see top nav, Activity is underlined in blue).
The Activity tab of Analytics offers a bird’s eye view of all activities completed and logged through different channels, be they Flows, direct-from-inbox, the OmniDialer, and/or OmniActions.
Here you can glance at what's driving success and how to improve with a view of data from across the different tabs, and supplying you with a handful of additional filters to further refine your view.
Filtering Analytics Data
The data shown in Groove Analytics is determined by the criteria specified in the Team Selector and Date Selector. Filter your Analytics page to view data to narrow and expand the user range and timeframe for which you'd like to view analytics.
Team Selector
On each tab of the Analytics page, you can select individual users, teams, or a combination of both to drill into the performance on Flows acted upon by these users. This feature enables you to compare metrics across any grouping of team members.
Date Selector
On each tab of the Analytics page, you can also customize the date range (top right) to represent the data shown. All Flows that have been acted upon within this timeframe will surface in Groove Outcomes.
Additional Filters
At the top right, further refine the data surfacing in Activity tab to further based on their origin and whether they’ve been logged to Salesforce. Adjusting these filters will affect the metrics across the entire Activities tab of Analytics.
- Flow and non-Flow Activities: Filters the Activity tab to include all activities that originated both from Flows and from outside of Flows.
- Flow Activities: Filters the Activity tab to only include activities that originated from Flows.
- Non-Flow Activities: Filters the Activity tab to only include activities that originated outside of Flows.
- Only Show Activities Logged to Salesforce: Filters the Activity tab to only include activities that have been logged to Salesforce in the various counts. This filter is an overlay to the above three filters, which narrow the data based on the origin of the activities.
Top Metrics
The Top Metrics (at top) help to bucket activities into groups to provide a high-level overview of the activities completed by all users included in the Team Selector within the timeframe specified in the Date Selector.
Total Activities: The sum of all activities completed by all users included in the Team Selector within the timeframe specified by the Date Selector, including emails, calls, and “other” activities. The count here should match the total of the subsequent Email, Call, and Other activity counts.
Emails: The total number of emails that were sent by by all users included in the Team Selector within the timeframe specified by the Date Selector. Emails are only eligible to contribute toward this count if they were sent from a Groove Flow, tracked, and/or logged to Salesforce using Groove's manual logging UI or background email sync.
Calls: The total number of calls that were completed by all users included in the Team Selector within the timeframe specified by the Date Selector. Calls are only eligible to contribute toward this count if they were completed through a Groove Flow, placed through the OmniDialer, and/or manually logged through Groove via the OmniDialer or otherwise.
Other: The total number of non-email and non-call activities that were logged to Salesforce through Groove by all users included in the Team Selector within the timeframe specified by the Date Selector. This count includes LinkedIn Connection, LinkedIn InMail, Sendoso, SMS, Direct Mail, and “Other” action types that have been completed and logged through a Groove Flow or OmniActions. “Other” actions are defined as any non-email and non-call activities that are standard in Groove Flows or are represented by the placeholder “Take Another Action” activity type.
Chart
The chart offers a visual representation of the activities completed by all users included in the Team Selector within the timeframe specified by the Date Filter. It should reflect the counts displayed numerically in other areas of the Activity tab.
Bar Graph
The bar graph at the top in the image above displays the activities surfaced on the Activity tab according to the time range and user/team filters in a bar chart. The activities included in the chart should reflect the numerical activity counts displayed in other areas of the Activity tab; however, the chart can be further refined through the user of the below two filters without affecting the activity counts on other areas of the tab.
- Activity filter (top right of bar graph): Surfaces All Activities (an aggregate of Email, Call, and Other activities delineated by color) or single activity types (e.g. Email, Call, and Other).
- Time filter (top right of bar graph): Adjusts the date interval displayed on the x-axis of the bar graph. The options available include Days, Weeks, and Months, with the individual utility of each of these options hinging on the time range selected for the analytics query in the filters in the upper-right of the page.
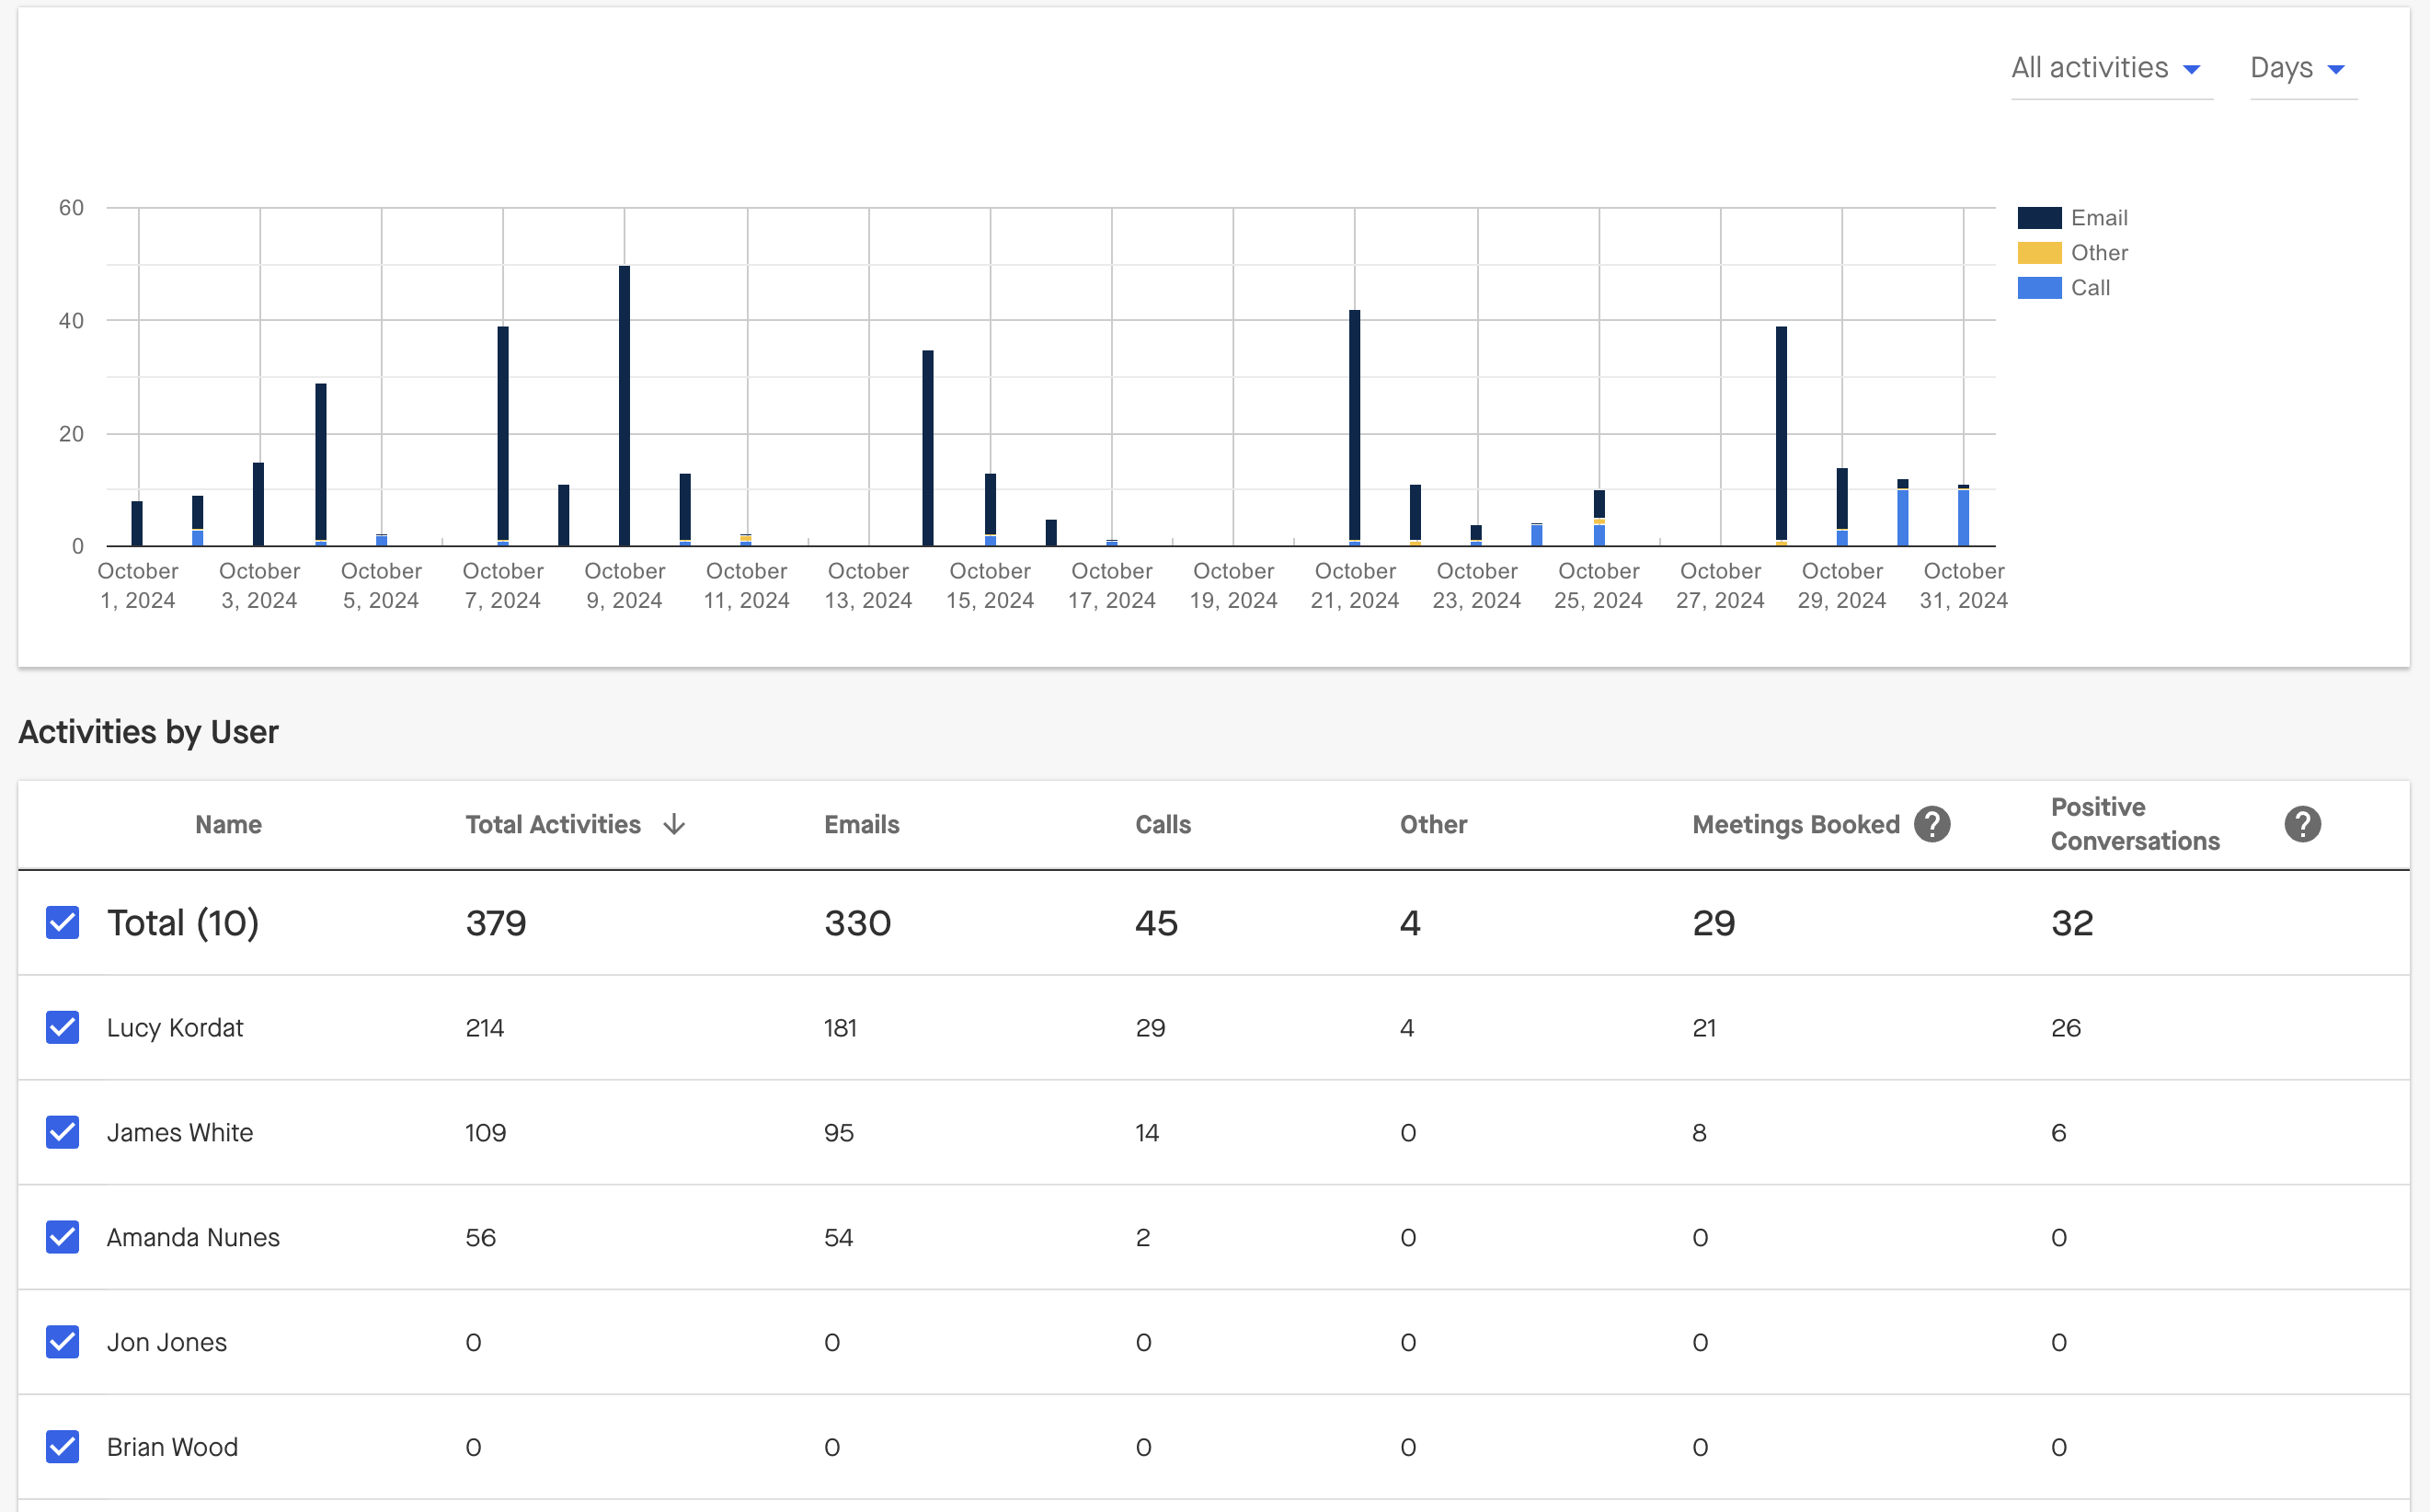
Activities by User
Under the bar graph, the Activities by User section offers a more granular look at activity completion by parsing out activity completion at the individual-user level according to the time range and user/team specifications configured in the filters in the upper-right corner of the page.
Name: The name(s) of the user(s) included in the user/team filter in the upper-right corner of the page.
Total Activities: The sum of all activities completed by each user included in the user/team filter within the time period specified by the date filter, including emails, calls, and other activities. The count here should match the total of the corresponding Email, Call, and Other activity counts for the same user.
Emails: The total number of CRM Relevant Emails that were sent by each user included in the user/team filter within the timeframe specified by the date filter. See B. above for the inclusion criteria for emails in this count.
Calls: The total number of CRM Relevant Calls that were completed by each user included in the user/team filter within the timeframe specified by the date filter. See C. above for the inclusion criteria for calls in this count.
Other: The total number of non-email and non-call activities that were logged to Salesforce through Groove by each user included in the user/team filter within the timeframe specified by the date filter. This count includes LinkedIn Connection, LinkedIn InMail, Sendoso, SMS, Direct Mail, and “Other” action types that have been completed and logged through a Groove Flow or OmniActions.
Meetings Booked: The total number of meetings booked and synced to Salesforce by Flow participants within the time range set in the filter. A meeting meets the criteria for this metric if an attendee on the Salesforce Event record has completed at least one step in a Flow, regardless of whether or not they are still active in that Flow. The meeting is attributed to the user in whose Flow the participant most recently completed a Flow Step, regardless of which Groove user is the organizer of the meeting. There is no time cap on how long after completing a Flow Step the meeting must have been created in Salesforce to qualify for this metric. This metric looks at the Created Date for the Event record rather than the Start and End time on the Event record. Currently, this meeting is only supported for G-Suite customers.
Positive Conversations: The total number of calls placed through the OmniDialer by each user included in the user/team filter within the timeframe specified by the date filter that were logged with a positive sentiment (according to the call sentiment mapping an org has configured in MMO).
Flow Analytics
The Flow Analytics tab provides a snapshot of your team's completion metrics for activities that originated from Flows. Each Flow executed on by a user included in the user/team filter within the timeframe specified by the date filter should surface, along with its individual activity completion metrics, as well as contributing toward the total activity counts within the tab. Activities that did not originate from a Flow but were completed as follow-up efforts to activities that did originate from a Flow will not surface in this tab.
Standard Flow Metrics
As in the image above:
Flow Name: The names of all Flows that were executed on by a user included in the Team Selector within the timeframe specified by the Date Selector.
Steps Completed: The total number of activities completed in each Flow by the users specified in the Team Selector within the timeframe specified in the Date Selector. All Flow Step types qualify as a separate step that can count toward this metric; each step in a multi-day step should qualify as a separate step that can count toward this metric.
Opened: The percentage of all Flow emails that were sent by users included in the Team Selector within the timeframe specified in the Date Selector for which Groove detected an email open. A Flow email being opened multiple times should not inflate this percentage; only the first open of an email should count toward this percentage.
Clicked: The percentage of Flow emails with links in them that were sent by users included in the Team Selector within the time range specified in the Date Selector whose links were clicked. Attachment clicks should also count positively toward this metric so long as the “Direct Attachment” setting is disabled in MMO. A link in a Flow email being clicked multiple times should not inflate this percentage; only the first click of a link in a Flow email should count toward this percentage.
Replied: The percentage of Flow emails that were sent by users included the Team Selector within the timeframe specified by the Date Selector for which Groove detected a reply. A single Flow email being replied to multiple times will not inflate this percentage; only the first reply to a single Flow email should count toward this percentage.
Meetings Booked: The total number of meetings booked within the timeframe specified in the Date Selector that were generated as the result of a Flow action by a user included in the Team Selector. Meetings count toward this metric if the attendee on the meeting most recently completed a Flow step by a user included in the Team Selector, regardless of the Groove user listed as the organizer on the corresponding Salesforce Event record. The Flow participant must have completed at least one step in a Flow prior to a meeting being booked with them for the meeting to count toward this metric. Currently, this metric is only supported for G-Suite customers.
Positive Conversations: The total number of Call Steps that were completed within a Flow by users included in the user/team filter within the timeframe specified in the date filter that were logged with a positive sentiment result (per the call sentiment mapping an org has configured in MMO).
Flow Drill Down
From Flow Analytics tab, see the View Details column at the far right. Clicking on the icon in this column shows a window with richer insight into the analytics on each Flow. Like this:
Within the pop-up, the above mentioned Flow Analytics for the users included in the Team Selector within the timeframe specified by the Date Selector can be narrowed to the Flow Step- and User-level. For each step within the selected Flow, the Breakdown By Step section offers visibility into:
-
the day number, function, and default template subject line;
-
-
the number of steps that were completed, skipped, or queued;
-
the percentage of emails sent from the step (irrelevant for non-email steps) for which Groove has detected at least one email open;
-
the percentage of all link-tracked emails sent from the step (irrelevant for non-email steps and non-link tracked email steps) for which Groove has detected at least one email click; and
-
the percentage of emails sent from the step (irrelevant for non-email steps) for which Groove has detected at least one reply.
For each user who has completed an action the Flow within the timeframe specified by the Date Selector, the Breakdown By User section offers insight into;
-
the number of actions that were completed outright or queued;
-
the number of email steps that were completed outright or queued;
-
the number of call actions that were completed;
-
the percentage of all emails that were sent from email steps (irrelevant for non-email steps) for which Groove has detected at least one email open;
-
the percentage of all link-tracked emails that were sent from email steps (irrelevant for non-email steps and non-link tracked email steps) for which Groove has detected at least on link click; and
-
the percentage of all emails sent from the step (irrelevant for non-email steps) for which Groove has detected at least one reply.
Campaign Metrics
If your team has linked your Flows to Campaigns, you can use the "Shown Campaign Statistics" toggle at the top of Groove Analytics Flows Tab, to pull metrics on your Campaigns from Salesforce straight into the Flow Analytics table:
Converted Leads in Campaign: The total number of Leads in the Campaign(s) that are linked to the corresponding Flow that have been converted into Contacts within the timeframe specified by the Date Selector.
Opportunities in Campaign: The total number of Opportunities that have been linked to the Campaign(s) that are linked to the corresponding Flow within the timeframe specified by the Date Selector.
Value Opportunities in Campaign: The total value of all Opportunities that have been linked to the Campaign(s) that are linked to the corresponding Flow within the timeframe specified by the Date Selector.
Won Opportunities in Campaign: The total number of “won” Opportunities that have been linked to the Campaign(s) that are linked to the corresponding Flow within the timeframe specified by the Date Selector.
Value Won Opportunities in Campaign: The value won from Opportunities that have been linked to the Campaign(s) that are linked to the corresponding Flow within the timeframe specified by the Date Selector.
Template Analytics
The Email Template Analytics tab is intended to provide a glimpse into which email templates at an org are driving success and which may need some refinement. This tab surfaces both the templates used in Flow and non-Flow email communications, and the engagement metrics for those templates.
Email Analytics
The Email Analytics tab is serves as a running log of all outbound email communications originating from both Flow and non-Flow communications that were sent by users included in the Team Selector within the timeframe specified by the Date Selector.
Top Metrics
The top metrics in the Email Analytics Tab offer an aggregated snapshot of all outbound email communications originating from Flow and non-Flow sources that were sent by all users included in the Team Selector within the timeframe specified by the Date Selector.
Total Sent: The total number of outbound tracked and/or logged emails sent by all users included in the Team Selector within the timeframe specified by the Date Selector.
Personalization: The average percentage of difference between the email sent and the template used to create that email, when applicable. The percentage of different is calculated using the Levenshtein Distance formula.
Opened: The average open rate of tracked, outbound emails sent by users included within the Team Selector within the timeframe specified in the Date Selector.
Clicked: The average percentage of all tracked, outbound emails sent by users included in the Team Selector within the timeframe specified by the Date Selector for which Groove has detected at least one link click.
Replied: The average percentage of all tracked, outbound emails sent by users included in the Team Selector within the timeframe specified by the Date Selector for which Groove has detected at least one reply.
Email Analytics By User
The Email Analytics by users (info beneath the top metrics) serves as a running log of all outbound email communications by user so long as those emails originated from a Flow, have been logged/synced to Salesforce, and/or include a Groove tracking pixel. This section of this tab breaks down the total email send count into user-by-user metrics.
Name: The names of each user included within the Team Selector.
Total Sent: The number of all tracked and/or logged outbound emails sent by each user included in the Team Selector within the timeframe specified by the Date Selector.
Opened: The percentage of all tracked, outbound emails sent by the corresponding user within the timeframe specified by the Date Filter for which Groove has detected at least one email open.
Clicked: The percentage of all link-tracked, outbound emails sent by the corresponding user within the timeframe specified by the Date Selector for which Groove has detected at least one link click.
Replied: The percentage of all tracked, outbound emails sent by the corresponding user within the timeframe specified by the Date Selector for which Groove has detected at least one reply.
Personalization: The average percentage of difference between the emails sent by the corresponding user and the template used to create that email. The percentage of difference is calculated using the Levenshtein Distance formula.
Email Log
Email Log: Clicking the icon in this column will pop out a window that displays the corresponding user's email history.
A user’s Email Log will show all outbound, tracked emails a user has sent within the timeframe specified by the Date Selector that comprise the overall metrics in their row of the Email Analytics By User table. Each email in the Email Log will be accompanied by:
-
the subject line of the email;
-
the name(s) of the recipient(s)
-
the events, which is defined as the sum of email opens, clicks and replies;
-
the number of email opens;
-
the number of link clicks, which should include attachment clicks so long as the “Direct Attachment” setting is disabled in MMO;
-
an indication of whether the email has received a reply; and
-
the personalization percentage.
Call Analytics
The Call Analytics tab summarizes all Flow and non-Flow call activities for the users placed through the OmniDialer and/or otherwise logged through Groove by the users included in the Team Selector within the timeframe specified by the Date Selector. This tab enables you to gain macro- and micro-level insight into which calls are driving success, pinpoint best calling practices, and determine where there may be opportunities to pivot strategy.
Top Metrics
The top metrics in the Call Analytics tab offer high-level insight into call communications to aid with visualizing where wins are being sourced.
Calls: The total number of calls placed through the OmniDialer and/or otherwise logged through Groove by all users included in the Team Selector within the timeframe specified by the Date Selector.
Conversation Rate: The percentage of all calls placed through the OmniDialer and/or otherwise logged through Groove by all users included in the Team Selector within the timeframe specified by the Date Selector that resulted in a conversation. A conversation is defined as Groove detecting that a customer has answered the call.
Positive Conversation Rate: The percentage of all calls placed through the OmniDialer and/or otherwise logged through Groove by users included in the Team Selector within the timeframe specified by the Date Selector that resulted in a conversation outcome tied to a positive conversation sentiment (as determined by the your org’s call sentiment mapping in Manage My Org).
Charts
The bar charts beneath the top metrics on the Call Analytics Tab offer a visual representation into the breakdown of the conversation outcomes for any calls placed through the OmniDialer and/or otherwise logged through the Groove.
Call Status: Breaks down all calls placed through the OmniDialer and/or otherwise logged through Groove by users included in the Team Selector within the timeframe specified in the Date Selector according to the percentage that were logged with each of an your org's Call Status picklist values. The values in this chart include “Conversation” (which is an aggregate of all “Conversation” picklist values) and each of your org’s individual “No Conversation” values.
Conversation Outcome: Breaks down all calls placed through the OmniDialer and/or otherwise logged through Groove by all users included in the Team Selector within the timeframe specified in the Date Selector according to the percentage that were logged with each of an org’s individual Conversation Outcome picklist values.
Calls by Date and Time: A heat map that plots call and conversation frequency (depending on whether “Calls” or “Conversations” is being viewed) at different times of the day. The points with larger circles connote a larger numbers of calls and conversations. The “Calls” and “Conversations” tabs can be read alongside one another to determine times when the most calls are turning into conversations, when high volumes of calls are being placed but are not resulting in conversations, and when high numbers of conversations are happening but not many calls are being placed. In the context of this graph, a conversation is defined according to the values in your org’s “Conversation” vs. “No Conversation” picklist.
Calls By User
Scroll down to see the Calls By User section of the Call Analytics tabs enables users to drill down further into their team’s call activities by looking at call metrics and engagement on a per-user basis. Used in tandem with call recordings for calls deemed successful, users can isolate calls that exemplify best practices and to replicate actions that led to success.
Name: The name of each user who is included in the Team Selector.
Calls: The total number of calls each user included in the Team Selector placed through the OmniDialer and/or otherwise logged through Groove within the timeframe specified by the Date Selector.
Conversations: The total number of calls each user included in the Team Selector placed through the OmniDialer and/or otherwise logged through Groove within the timeframe specified by the Date Selector that resulted in a conversation. A conversation is defined as Groove detecting that a customer has answered the call.
Conversation Rate: The percentage of all calls each user included in the Team Selector placed through the OmniDialer and/or otherwise logged through Groove within the timeframe specified by the Date Selector that resulted in a conversation. A conversation is defined as a customer answering the call.
Positive Conversation Rate: The percentage of all calls placed through the OmniDialer and/or otherwise logged through Groove by each user included in the Team Selector within the timeframe specified by the Date Selector that resulted in a conversation outcome tied to a positive conversation sentiment (as determined by your org’s call sentiment mapping in Manage My Org).
Call Log
Call Log: Clicking the View More icon in the Call Log column will show a window that displays the corresponding user's call history.
A user’s call log will show all calls placed within the timeframe specified by the Date Selector that comprise the overall metrics in their row of the Calls By User table. Each call in the user’s Call Log will be accompanied by:
-
the name (or phone number, if the call was placed through the OmniDialer to a phone number not associated with a Contact or Lead record) of the call recipient;
-
the timestamp of the call in the viewing user’s timezone;
-
the duration of the call (not applicable for calls that went unanswered);
-
-
-
the name of the Flow from which the call originated, if applicable; and
-
Process Analytics
The Process Tab of Analytics grants visibility into how users included in the Team Selector have made use of their Flows within the timeframe specified by the Date Selector. The data in this page can be used to diagnose trends in Flow usage over time.
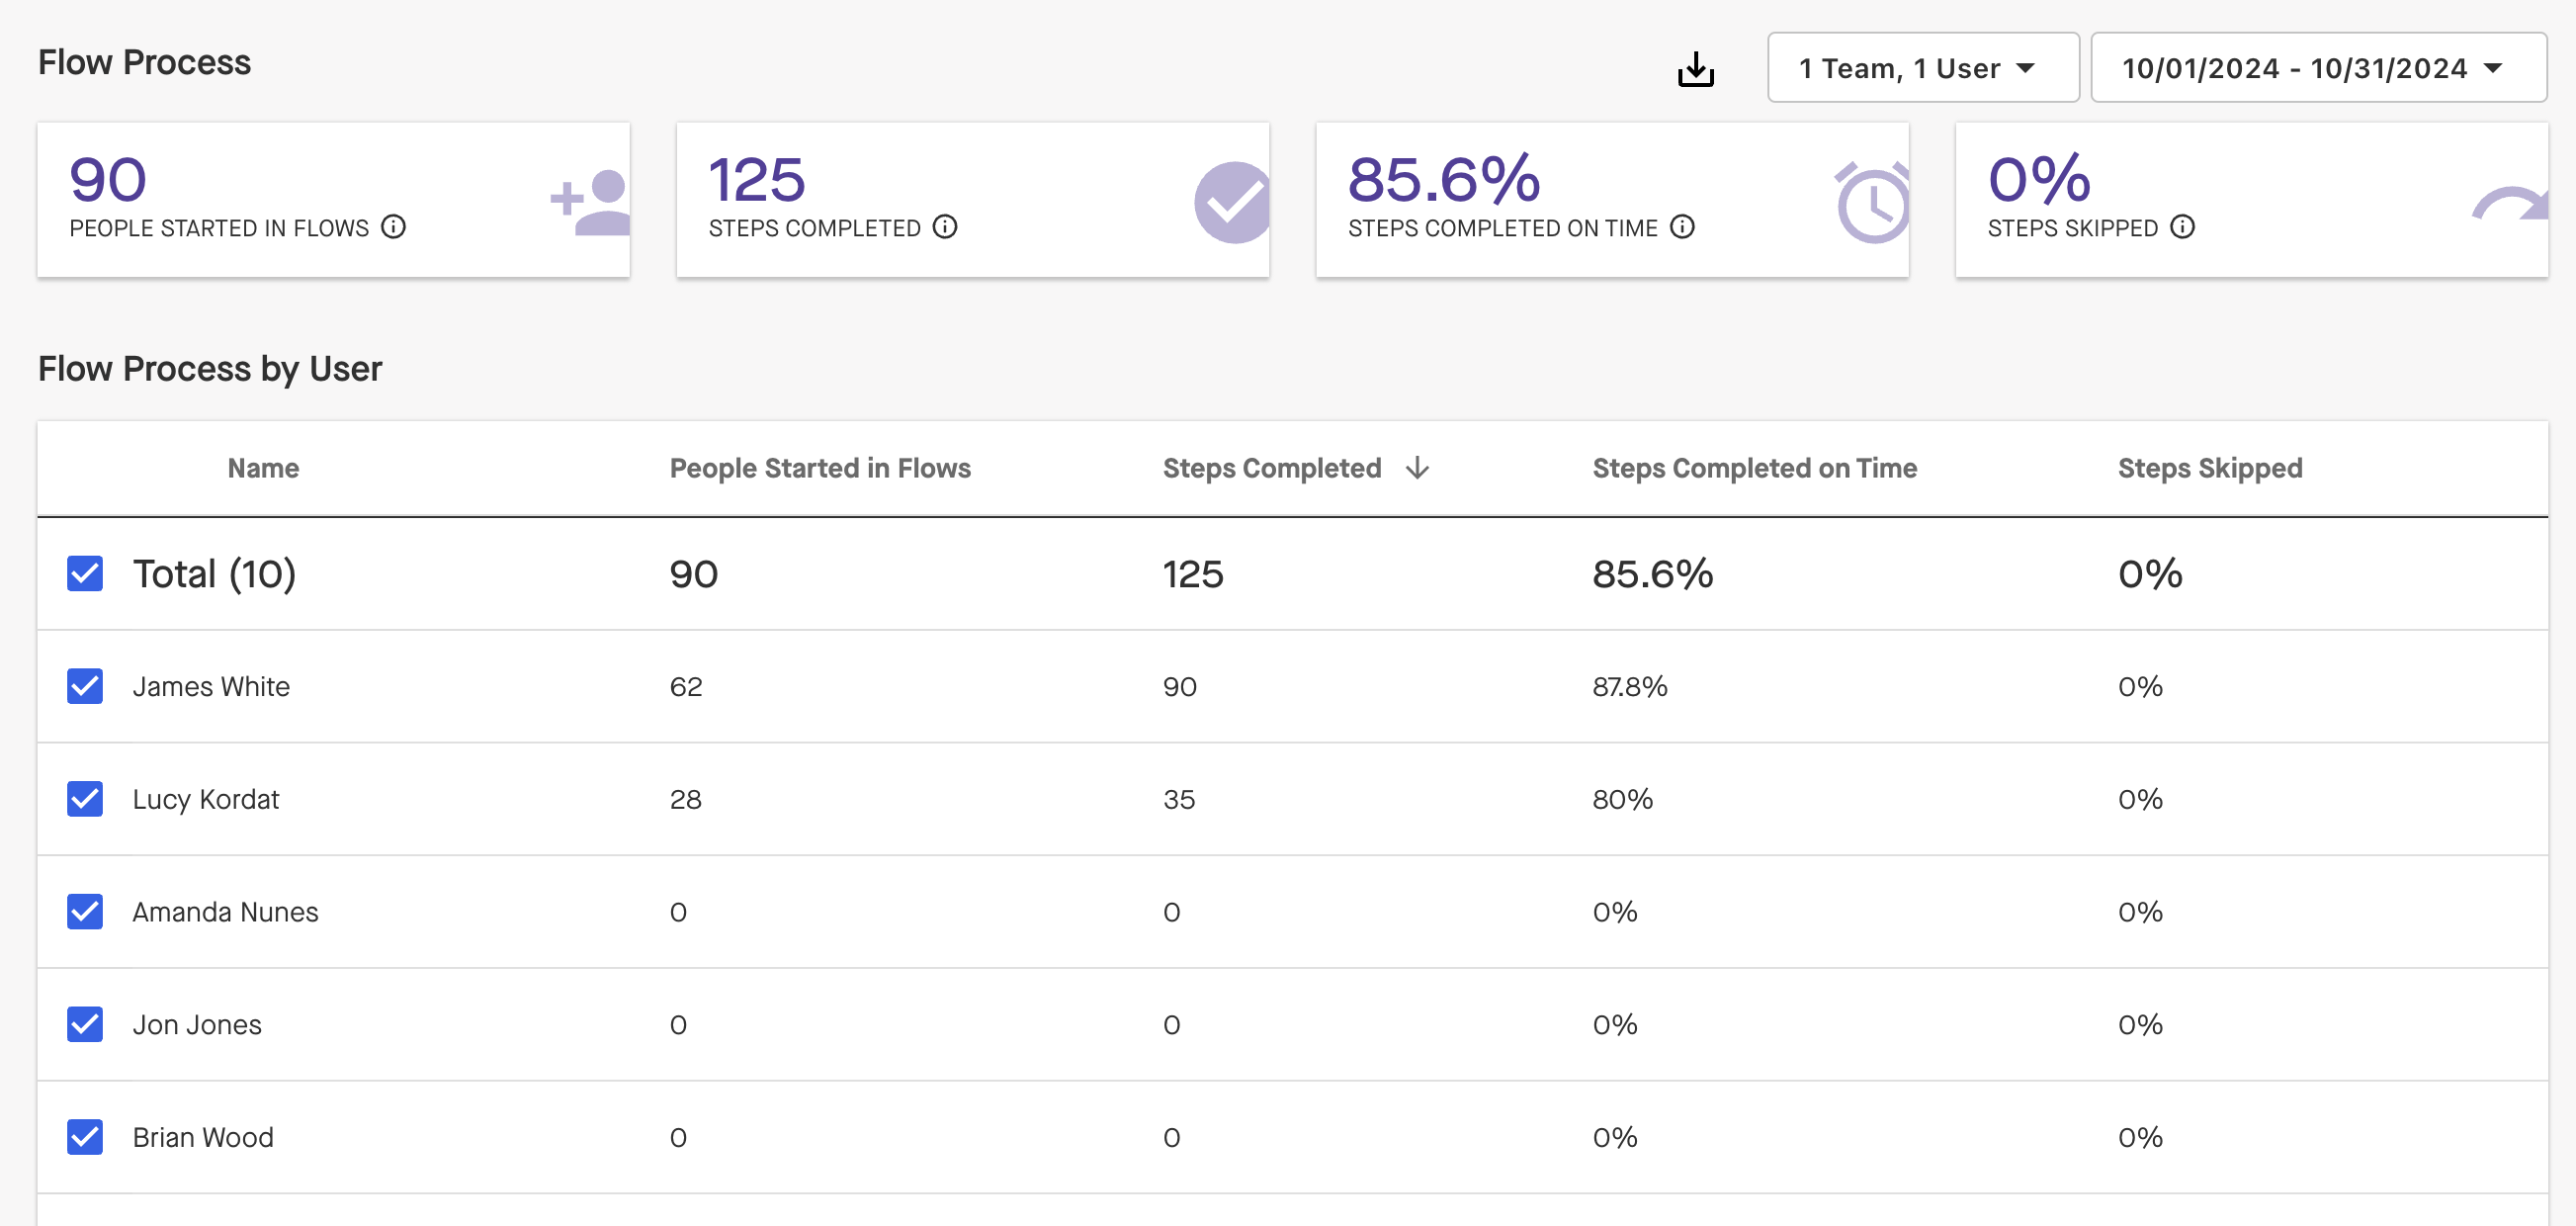
Top Metrics
The top metrics summarize Flow usage metrics across all users included in the Team Selector within the timeframe specified by the Date Selector to shed light on high-level trends in users' Flow usage.
People Started In Flows: The total number of unique Contacts of Leads who have completed at least one step in a new Flow (i.e. a Flow they have not previously completed a Step in) by all users included in the Team Selector within the time range specified by the Date Selector.
Steps Completed: The total number of Flow Steps completed by all users included in the Team Selector within the timeframe set by the Date Selector.
Steps Completed On Time: The percentage of all Flow Steps completed by all users included in the Team Selector within the timeframe set by the Date Filter on or before the day they are marked due.
Steps Skipped: The percentage of Flow Steps completed by all users included in the Team Selector within the timeframe set by the Date Selector that were skipped.
Process By User
Under top metrics, the Process by User section of the Process Tab homes in on how individual users have interacted with Flows in their workflow within the time range specified by the Date Selector.
Name: The name of each user who is included in the Team Selector.
People Started in Flows: The total number of unique Contacts of Leads who have completed at least one step in a new Flow (i.e. a Flow they have not previously completed a Step in) for each user included in the Team Selector within the time range specified by the Date Selector.
Steps Completed: The total number of Flow Steps completed by each user included in the Team Selector within the timeframe specified by the Date Selector.
Steps Completed on Time: The percentage of all Flow Steps completed by each user included in the Team Selector within the timeframe set by the Date Selector on or before the day they are marked due.
Steps Skipped: The percentage of Flow Steps completed by users included in the Team Selector within the timeframe set by the Date Selector that were skipped.
Downloading Analytics
On each tab of the Analytics page, you also have the option of exporting up to one year’s worth of that tab’s data for the users selected in the Team Selector by clicking the “Download CSV” button. This data will be delivered to the email address you are signed into Groove with as a CSV within roughly 15 minutes of the initiating the download.
Click the download icon at the top:

Then you'll get a download popup.
The data shown on each page of users’ Email Logs and Call Logs is also available for immediate download as a CSV by pressing the “Download CSV” button. This data in this CSV will reflect the time range selected in the Date Filter.
Additional Admin Configuration
Groove Admins can influence what data in Analytics is visible to their reps to allows them access to the data they will need to do their jobs the best.
Adding Groove Teams and Assigning Roles
If you do not have Groove Teams set up yet, we recommend creating teams and assigning Roles, so that team leads can easily check their team's progress.
Set up Teams in Team Settings. Click Teams > click New Team.
To set up Roles, and to learn more about Team Settings, read this article.
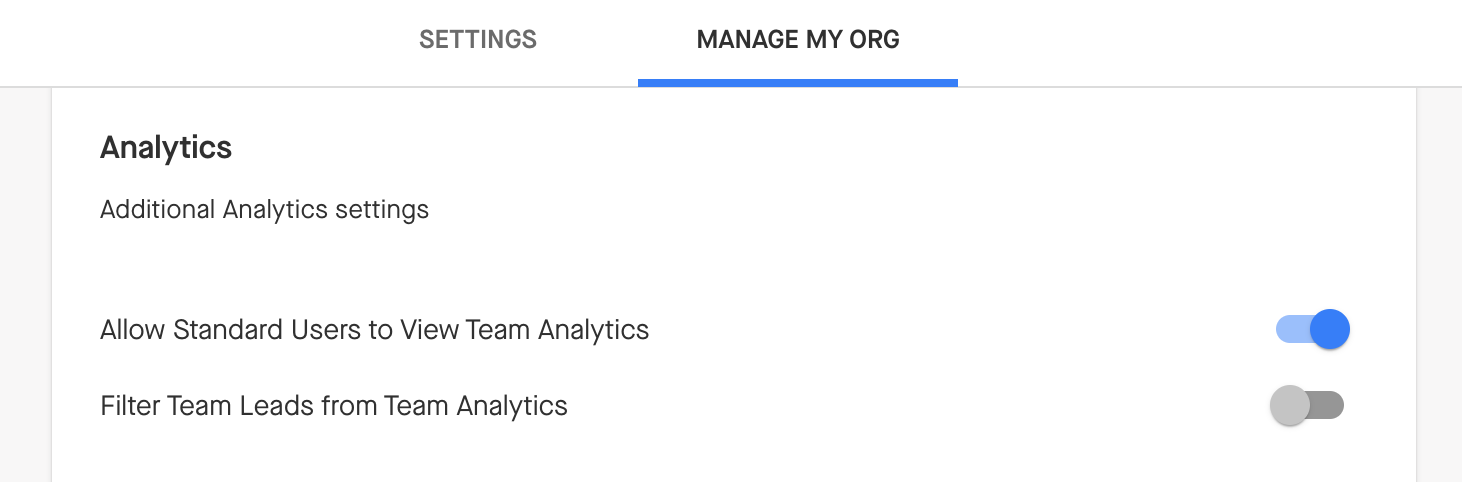
Analytics Settings
Configure Analytics settings in this section of Manage My Org. You can enable or disable these:
- Allow Standard Users to View Team Analytics: When enabled, this setting allows users to view the analytics of other users with whom they share team assignments alongside their own. When disabled, standard users will only be able to view their own, individual analytics.
- Filter Team Leads from Team Analytics: When enabled, this setting will remove the stats of users with the Team Lead roles from the Analytics page when the Groove Teams are chosen in the Team Selector. When disabled, the stats of users with Team Lead roles will be included on the Analytics page when Groove Teams are chosen in the Team Selector.