Opportunities Overview
The Opportunities Module is the main hub where reps can update their deals, and sales leaders can inspect not only CRM data, but also insights from different signals such as emails, meetings, and files. With flexible filtering and grouping options, the entire revenue team can get visibility into the business from different angles.
Navigating the Opportunities Module
This article will walk you through the basic navigation of the Opportunities module.
1. Saved Views Drop-Down
Views are reports or saved sets of Filters. Here, you’ll be able to find any of your own Views or Views that have been shared with you.

2. Mode Selector
Clari allows you to configure how deals are rolled up across the hierarchy. This is how we support matrix organizations that need an opportunity to roll up to one team when that opportunity is "owned" by another team. If you have multiple modes configured, these custom owner Modes will appear in the Mode selector.

3. Search Box
Use the Search  in the top right corner to search for any deal by Opportunity or Account name. Clari's Advanced Search allows you to quickly include Closed & Open Opportunities in the results and allows you to search by account.
4. Filters
Below the Saved Views Drop-Down, you can see the filters that are being applied to the Saved View. You can remove, adjust, or add additional filters in the Filters Bar itself.

5. Edit View Mode
When you click Edit View, you have access to all of the different filter options as well as the settings for your Saved View, the Amount field that will sum up the opportunities in the grid, and the Time Period for history tracked fields. You can edit your View or create and save a new View.

6. Groups
In the left-hand panel, you can add Groups to segment the deals in the Grid -sort of like a live pivot table! Drag and drop the Groups to reorder them, and click on the icon to toggle the grouping menu between the vertical and horizontal layouts.

7. Default Grid View
This view operates similarly to a spreadsheet, and all of the fields (with the exception of the CRM Score) are populated by your Salesforce data. As a rep, you can see your deals and make updates directly from the Grid that reflect back in Salesforce in real time.

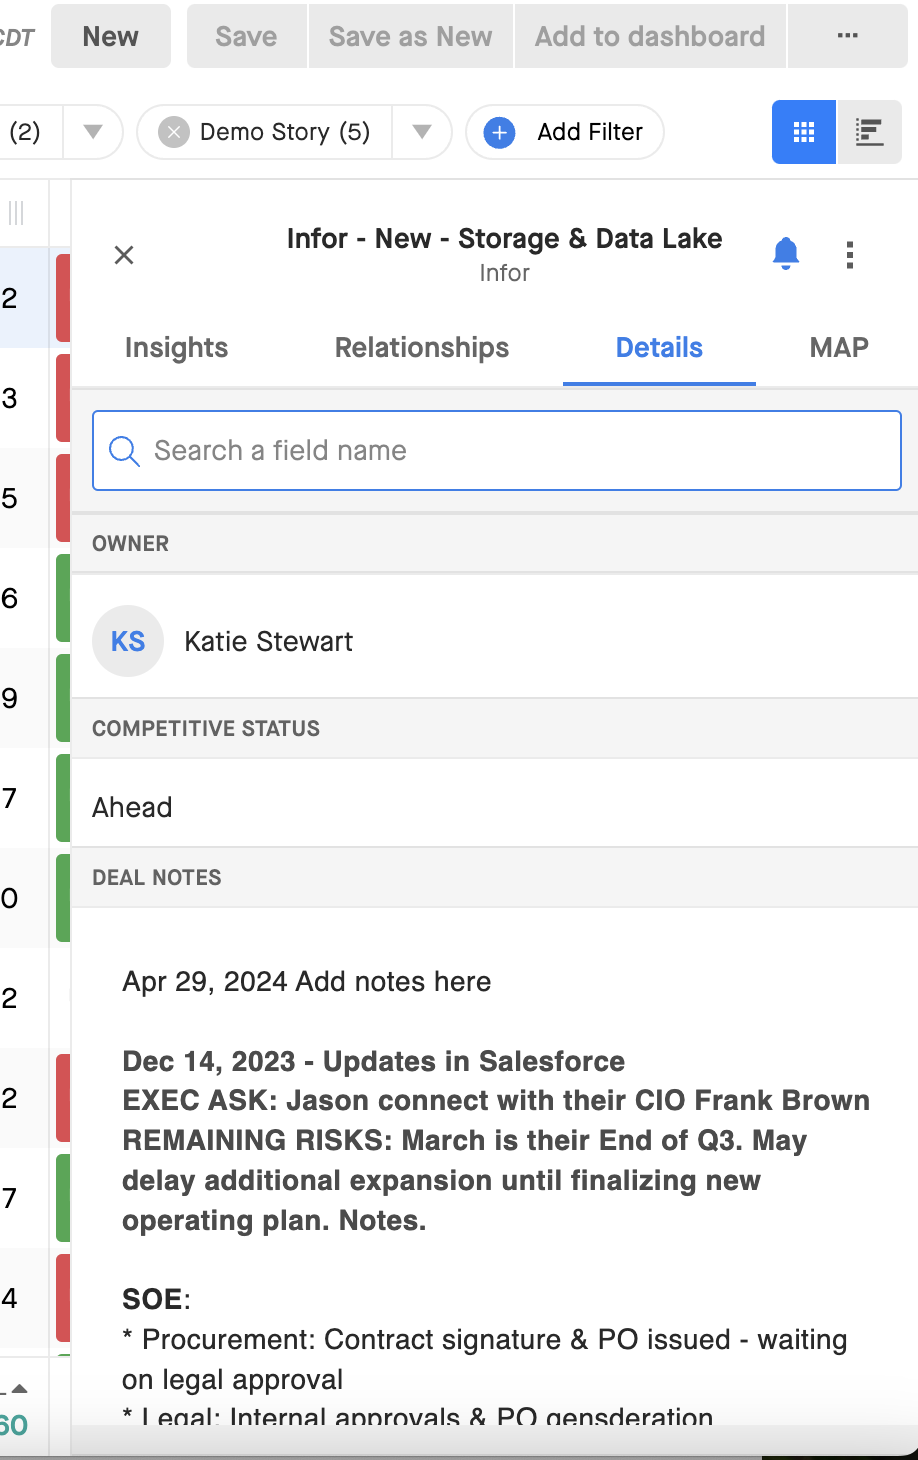
8. Insights, Relationships, and Details Side Panel
The Insights Panel to the right, provides insights into how your deals are progressing through the sales life cycle. To use it, click the eye icon on the right side of Clari. Or double click on any cell in the Opportunities Grid. There are tabs at the top of the insights panel:
Details tab
The Details panel is where you can configure Clari to capture all of the important information from your CRM fields. Configure your sales methodology fields here to allow your reps to keep their deals updated easily.
Insights tab
In one snapshot, you can see the CRM Score, email, calendar, and file data going back and forth between the owner of the deal and the Account, as well as other signals from sources like Marketo and Highspot.
Relationships Tab
At the top of the same panel above, click over to the Relationship Insights tab for a better understand your customer relationships using real-time engagement data. Understand which people are involved in every deal so that your team can ensure that they are working with all the right stakeholders to ensure successful outcomes.
MAP Tab
This tab tracks and, allows you to access, your Mutual Action Plan within Clari Align.
9. Actions Drop-Down
This menu at the top right of Clari under "Actions" gives you the option to export your data, pin a chart to your dashboard, configure your columns, and share your saved view with other Clari users in your org.
Export
From the Clari web view, you can export the current set of deals you're viewing to a CSV file. By default, the CSV file will contain all of the columns in the grid.
Configure Columns
To manage which columns are shown or hidden, select "Configure Columns" under the Actions Drop-Down. Toggle for any columns you would like to hide or show, and re-arrange the order of columns by using the drag-and-drop icon.
10. Chart/Grid Mode Toggle
These buttons allow you to toggle between Grid and Chart Modes. In Chart Mode, your first Group into the y-axis. It’s a great way to visualize your data based on your various Groupings.

